Linear relationships are examined in practically every discipline of the natural and social sciences. Using the statistics functions of the TI-83+/TI-84+ it is relatively easy to investigate this relationship by performing a linear regression on two variables, such as the following list:
| X | 1 | 3 | 5 | 7 | 9 |
| Y | 10 | 31 | 55 | 73 | 94 |
You can also find this tutorial for the TI-89/TI-92 Plus/Voyage 200 here.
Suppose X represents the number of workers in a certain factory and Y represents the number of widgets they are able to produce in an hour. Obviously, the more workers this factory has, the more widgets they will be able to produce. We can use a linear regression to determine the exact nature of this relationship.
From the home screen, press , , and then . This sets up the calculator’s built-in list editor.
Next, press , and to select the list editor. We’re going to be using L1 and L2 for this tutorial–if either has data in it, clear the list by selecting the name with the arrow buttons and pressing , then .
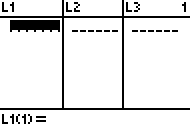
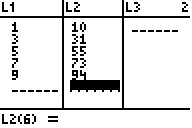
Now enter the X data into L1 and Y data into L2 by using the arrow buttons to select a cell, then pressing , typing in the corresponding number, and pressing again to confirm. The lists should automatically scale as you add more data.
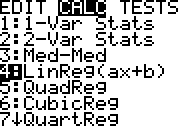
When done, press , , to select LinReg(ax+b).
Press to confirm. The calculator will display your regression equation.
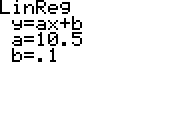
This display means that our regression equation is Y = 10.5X+.1. Using this equation, we can say that we would expect X=4 workers to produce around Y=44 widgets, even though we have no actual data collected for X=4.
If your calculator does not already, you can set it to display some correlation coefficients by pressing 2nd 0 to get to the catalog screen, then, since alpha-lock is automatically on, press to go down to the “D” section and use the arrow buttons to scroll down to DiagnosticOn.
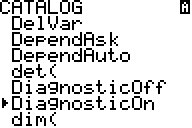
Press to paste it and again to confirm. Now re-run the linear regression and we get two more statistics:
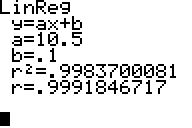
Little r is the coefficient of correlation, which tells how closely the data is correlated to the line. r² is the coefficient of determination, and represents the percentage of variation in data that is explained by the linear regression. These numbers are extremely common in elementary statistics.
Every time your calculator runs a regression, it stores the most recent regression equation in the variable RegEq. To access this variable, press . This is extremely helpful when you want to graph your regression line, for example when comparing to a plot of the original data.

29 Responses to Performing a Linear Regression on the TI-83+ or TI-84+