The TI-83 Plus and TI-84 Plus are optimized for performing many tasks in statistics, and one of their most powerful features is the ability to perform a variety of tests of statistical significance. With the statistics package installed, the TI-89, TI-92 Plus, and Voyage 200 also have much of this capability. This tutorial demonstrates how to use your graphing calculator to solve basic hypothesis testing problems such as the following using the Z-Test:
A researcher designs an experiment where a random sample of n = 50 high school seniors are given a pill to improve their concentration and problem solving skills. After being administered the pill, subjects take the SAT, and their scores on the SAT Math section are tabulated. The average score of student who took the pill is x̄ = 540. Given that the average score of all high school seniors on the SAT is μ = 510 with standard deviation σ = 100, is there statistically significant evidence that students who took the pill scored higher?
Setup
Before beginning the calculations, it is necessary to come up with specific hypotheses for the tests and choose a level of significance. In inferential statistics, there are two hypothesis, the null hypothesis, and the alternative hypothesis. The null hypothesis, denoted H₀, is always that the statistic measures of the treated group (in this case students given a pill) is the same as that for the general population. Since we are only interested in whether or not the pill has a positive effect, we are doing a one-tailed Z-Test, and our null hypothesis is:
H₀: μ <= μ₀
Where μ is the true mean (as opposed to sample mean) of scores of students in the treatment group. μ₀ refers to the known population mean, in this case 510. The alternative hypothesis H1 is what we expect if the treatment does have an effect on the population, and is always the opposite of the alternative hypothesis. Our alternative hypothesis is:
H₁: μ > μ₀
Finally, we have to choose a level of significance (α) for our test. It is possible that even if the treatment has no effect, we could get a mean score of 540. This seems unlikely and the chances of this happening goes down with the more subjects in the study, but the purpose of hypothesis testing is first of all to avoid coming to the wrong conclusion. The level of significance is a threshold probability below which we say that we have found statistical evidence. It is considered good practice to choose this beforehand so that the statistician doesn’t change α after wards in order to “find” statistical evidence where there is none. For most problems, a level of significance is:
α = .05
This means that if we find there is less than a 5% chance that the sample mean is higher than 540 by chance alone, we will conclude statistical significance.
Performing a Z-Test on the TI-83 Plus and TI-84 Plus
From the home screen, press to select the TESTS menu. “Z-Test” should already be selected, so press to be taken to the Z-Test menu.

Now select the desired settings and values. While it is possible to use a list to store a set of scores from which your calculator can determine the sample data, this problem doesn’t give individual scores, so make sure STATS is selected and press .
Enter the data given in the problem, μ₀ = 510, σ = 100, x̄ = 540, and n = 50. Finally, make sure to select >μ₀ for the alternative hypothesis.
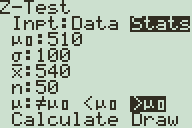
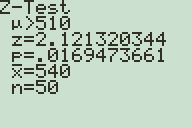
There are now two options for the output of the Z-Test: “Calculate” displays the z-score (the number of standard deviations x̄ is above or below the mean) and then the corresponding p-value, the probability of getting such a sample by luck alone.
“Draw” draws a normal distribution graph and displays the z-score and p-value at the bottom of the screen.
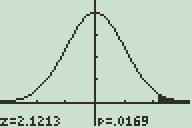
We have z = 2.12 and p = .017, which means that there is a 1.7% chance of seeing such a variation in sample mean by chance alone. Since p<α, we can conclude that there is significant evidence that the treatment group is different from the general population. Assuming good experimental practices, this implies (but does not prove) that taking the pill improves students' Math SAT scores. Note that this does not necessarily mean the pill improves concentration and problem solving skills as claimed-although these may be skills important for scoring higher on the Math SAT, this is a separate claim.
Performing a Z-Test on the TI-89, TI-92 Plus, and Voyage 200
Before you begin, it is necessary to have the proper software on your device. If you have a TI-89 Titanium or other newer calculator, then you should have a Stats/List Editor icon on your Apps screen. Otherwise, you should have a Stats/List Editor application in your Flash Apps folder. (Reached by pressing then ). If you don’t have this software or you aren’t sure, you can download it here.
Once you are in the Stats/List Editor app, press 2nd (F6) to enter the tests menu. Z-Test should already be selected, so press to confirm. You will be prompted for the data input method. Data uses a list containing the of scores from which your calculator can determine the sample data, this problem doesn’t give individual scores, so make sure STATS is selected and press .

Enter the data given in the problem, μ₀ = 510, σ = 100, x̄ = 540, and n = 50. Finally, make sure to select μ > μ₀ for the alternative hypothesis.
There are two options for the output of the Z-Test. Selecting “Results: Calculate” displays the z-score (the number of standard deviations x̄ is above or below the mean) and then the corresponding p-value, the probability of getting such a sample by luck alone.
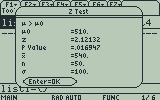
“Results: Draw” draws a normal distribution graph and displays the z-score and p-value at the bottom of the screen.
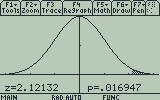
We have z = 2.12 and p = .017, which means that there is a 1.7% chance of seeing such a variation in sample mean by chance alone. Since p<α, we can conclude that there is significant evidence that the treatment group is different from the general population. As before, this implies (but does not prove) that taking the pill improves students' Math SAT scores.

One Response to Hypothesis Testing using the Z-Test on the TI-83 Plus, TI-84 Plus, TI-89, and Voyage 200